What is the buzz about?
Honeybees produce sound in the hive which can be heard when you are close to the hive. They do not hear with ears, but rather sense the vibrations transmitted by air and via the surface. In the dark they can even detect where on the comb a beewaggle dance is performed to help them find a favourable food source. The sound they produce can come from their wings or from their thorax (chest). There are various sounds which may be distinguished including:
- The flight of the bees near the entrance of the hive
- Fanning of the wings to speed up the evaporation of water from the nectar i.e. to ripen the honey in the hive or fanning to cool down the hive
- New queen cells in the colony can lead to tooting and quacking sounds which can easily be heard when one happens to be close to the hive when it occurs
- General restlessness can have various causes such as robbing of stock by another colony or wasps or hornets. Higher frequency generally indicates higher intensity and excitement
With a microphone placed in the hive, usually on the bottom board, these sounds can be recorded continuously. The BEEP base hive measurement system can record audio and on the device process the raw recording into a light-weight frequency pattern. The advantages of this approach are that the data can be stored on the local flash drive and that it can be transmitted wirelessly via the low-bandwidth, low energy LoRa network. With the BEEP base this means that each transmission is maximum 50 bytes which allows for extremely low energy use.
How does it work? Every 15 minutes, or another interval as determined by the beekeepers/researcher, the audio is recorded. Using a Fast Fourier Transformation (FFT) the raw data is converted to a set number of ‘frequency bins’. The number per bin is the number of times this frequency was detected per measurement. The default frequency range is 71 to 583 Hz divided over 10 bins: 71-122, 122-173, 173-224, 224-276, 276-327, 327-378, 378-429, 429-480, 480-523, 532-583 Hz. This can be changed using the BEEP base app.
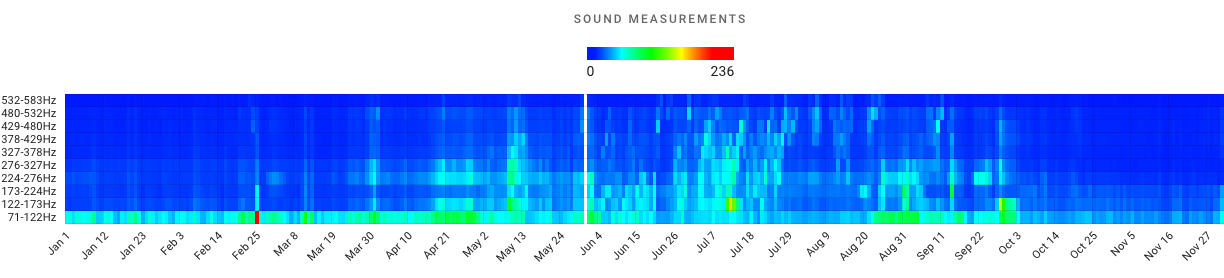
Above: an 11-month overview of sound data of one hive displayed in a new chart visualisation in version 3 of the BEEP app. The colours represent the number of times a frequency bin (see y-axis) is measured during a measurement which is taken four times per hour.
Interpretation of bee sounds seems straightforward but in practice it is not as BEEP community member Wouter Brok pointed out in his presentation. His experiment shows for example that after feeding in autumn, one can see from the sound pattern when the feeder is empty. Various technologies exist which make use of beehive sound. Variations in colonies, time of year, hardware and hive configuration can cause disturbances in the automatic processing of sounds and leads to unreliability in interpretations. Many experiment with hardware and data interpretation, see for example the open source Hiveeyes forum thread on bee audio.
BEEP has therefore chosen to contribute to the B-GOOD honeybee research project in which machine learning is applied on data collected in a large variety of situations across Europe. In this way, the key aspects of bee colony sounds can be linked to colony status and health, the main aim of the project. Features resulting from the research will be implemented on the BEEP platform. Do you want to contribute in any way, please let us know.
